London Population Over the Years
After a few weeks of intense work sharpening my R skills, I figured it was about time to start pushing out some code. One of my favourite blog is the awesome Spatial Analysis, so why not starting with some maps?
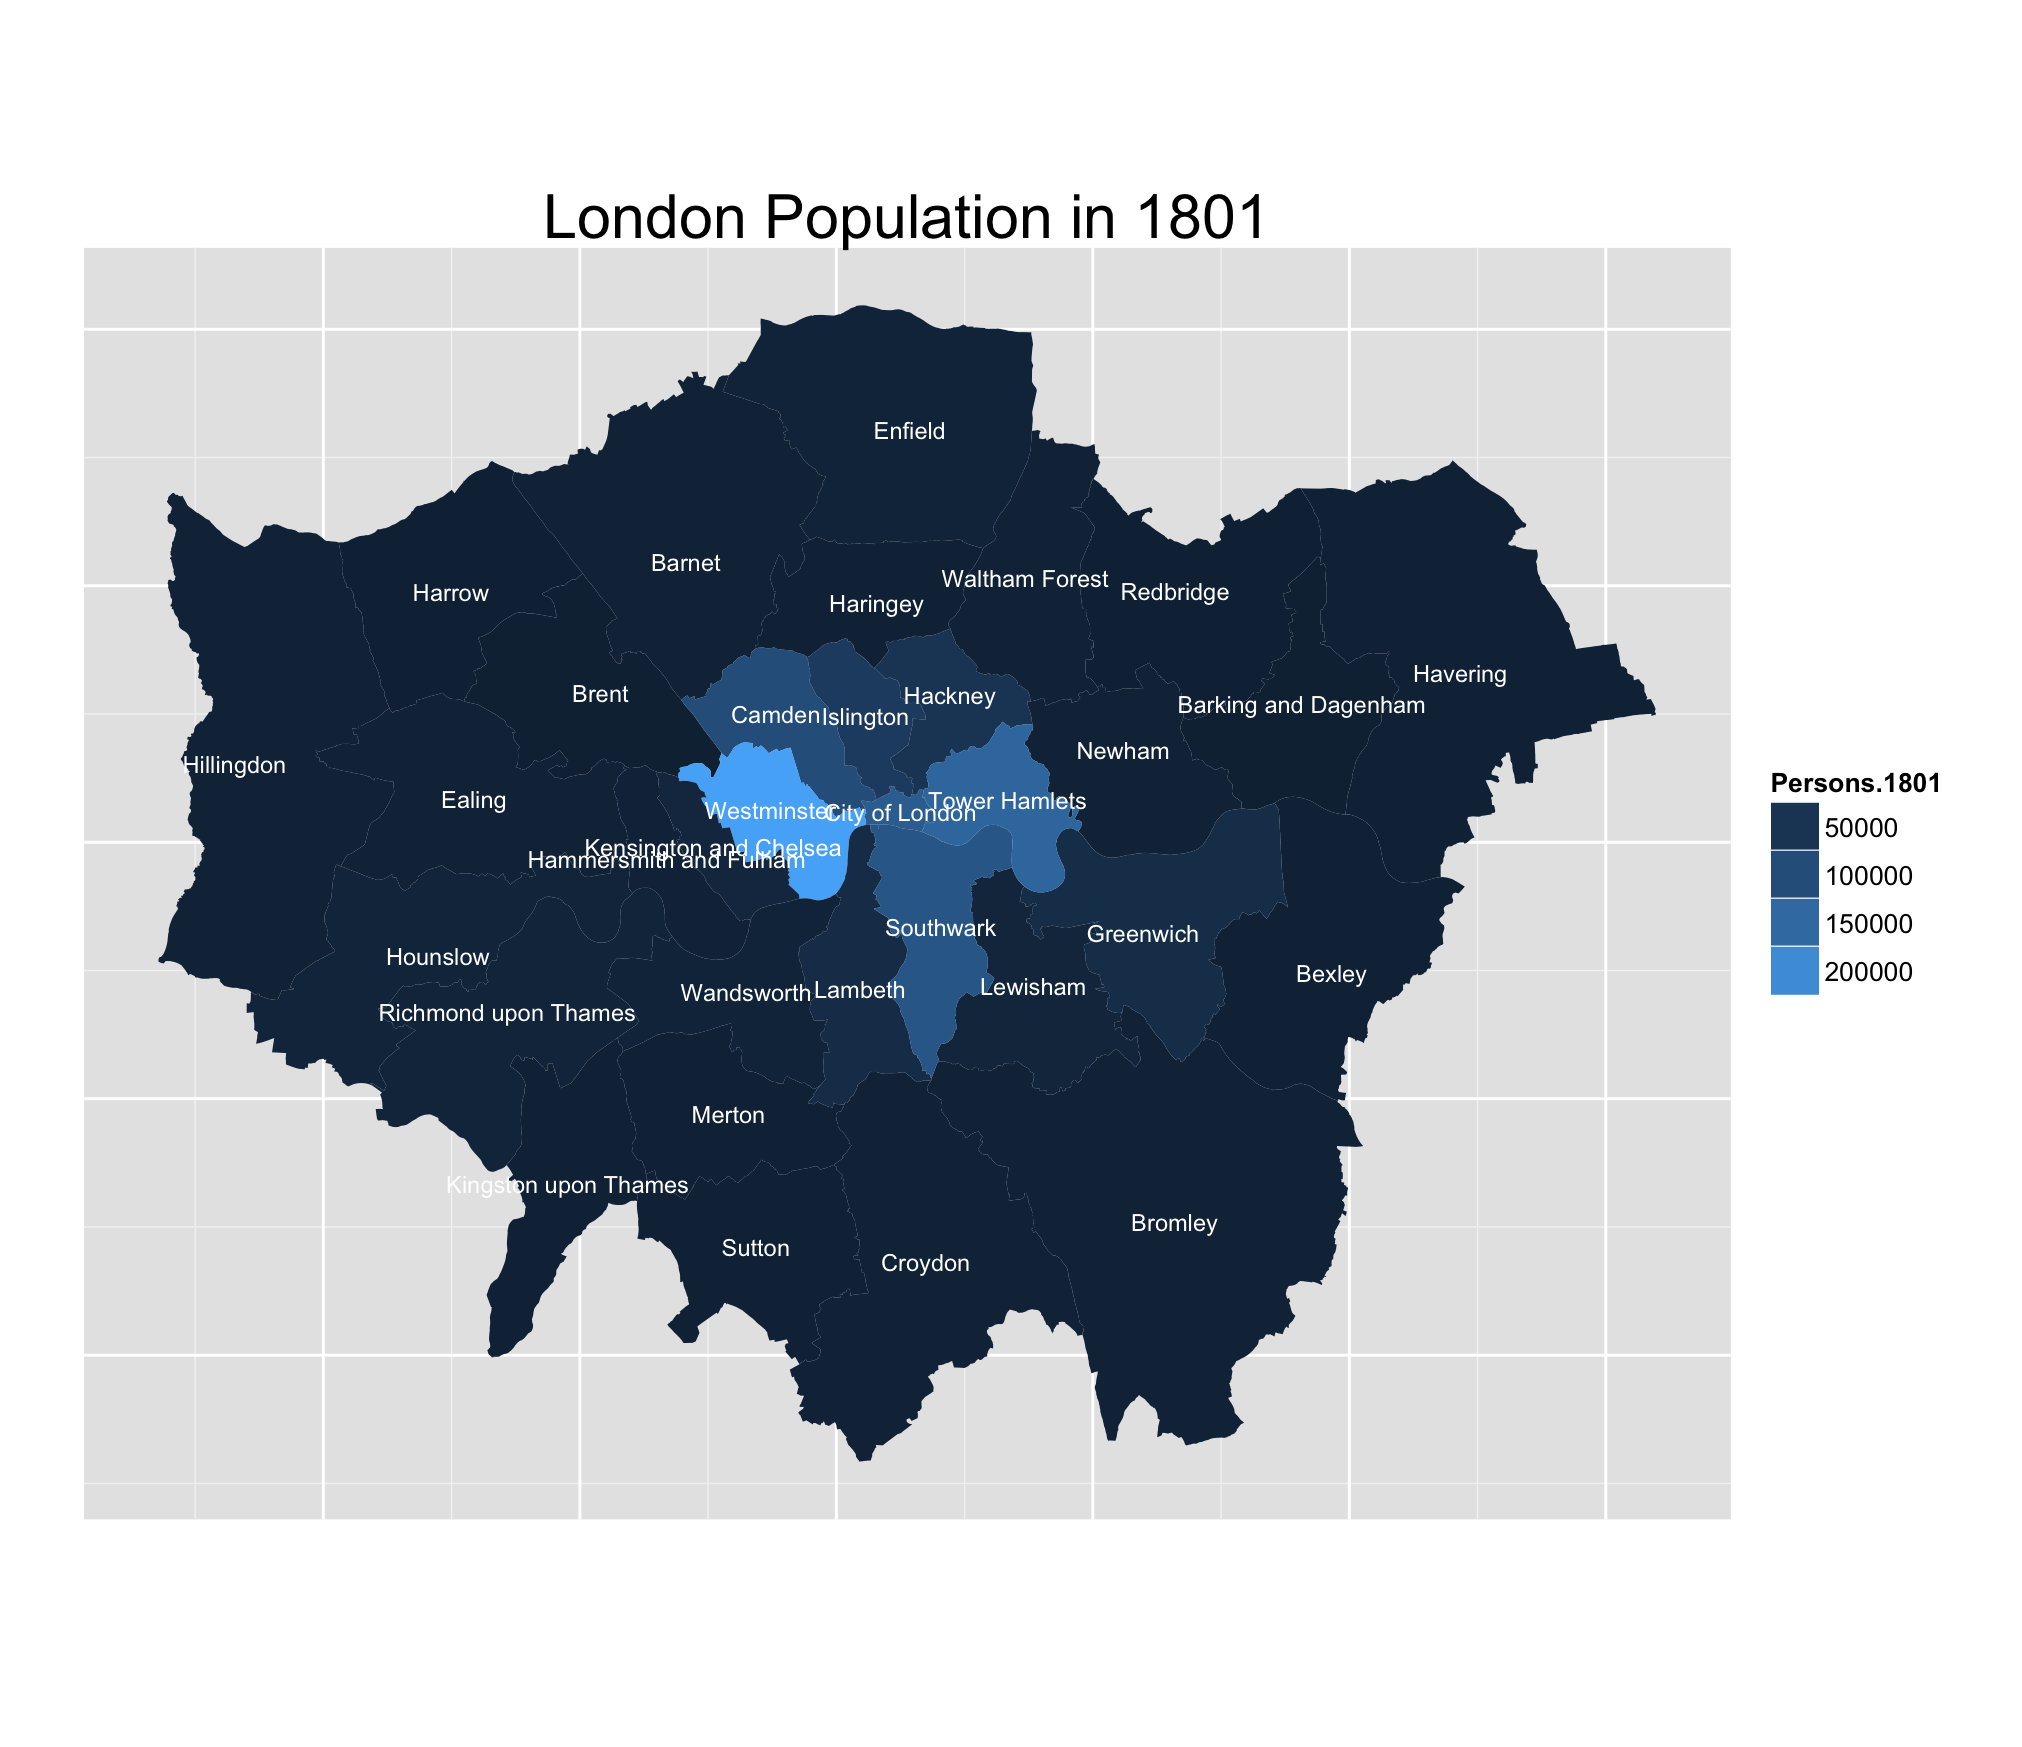
The maps displayed in this blog post are the combination of two distinct datasets:
- The UK "Boundary Line" dataset, downloadable (after a tricky and tedious procedure) from this website
- The Historic Census dataset downloadable from the London Datastore website
The first dataset (Boundary Line) contains the polygons (shapelines) defining British counties, districts, cities, ... I used ggplot2 to display the shapelines (mostly because I wanted to learnt it better).
The second dataset contains the population in each London borough from 1801 to 2001. Merging the two dataset is immediate. The full code is on Github, and 36 lines of codes are all you need to load, merge and display the data.
The different images show, as expected, how the population has progressively increased in number, and moved away from the central boroughs (Westminster, City of London in particular).
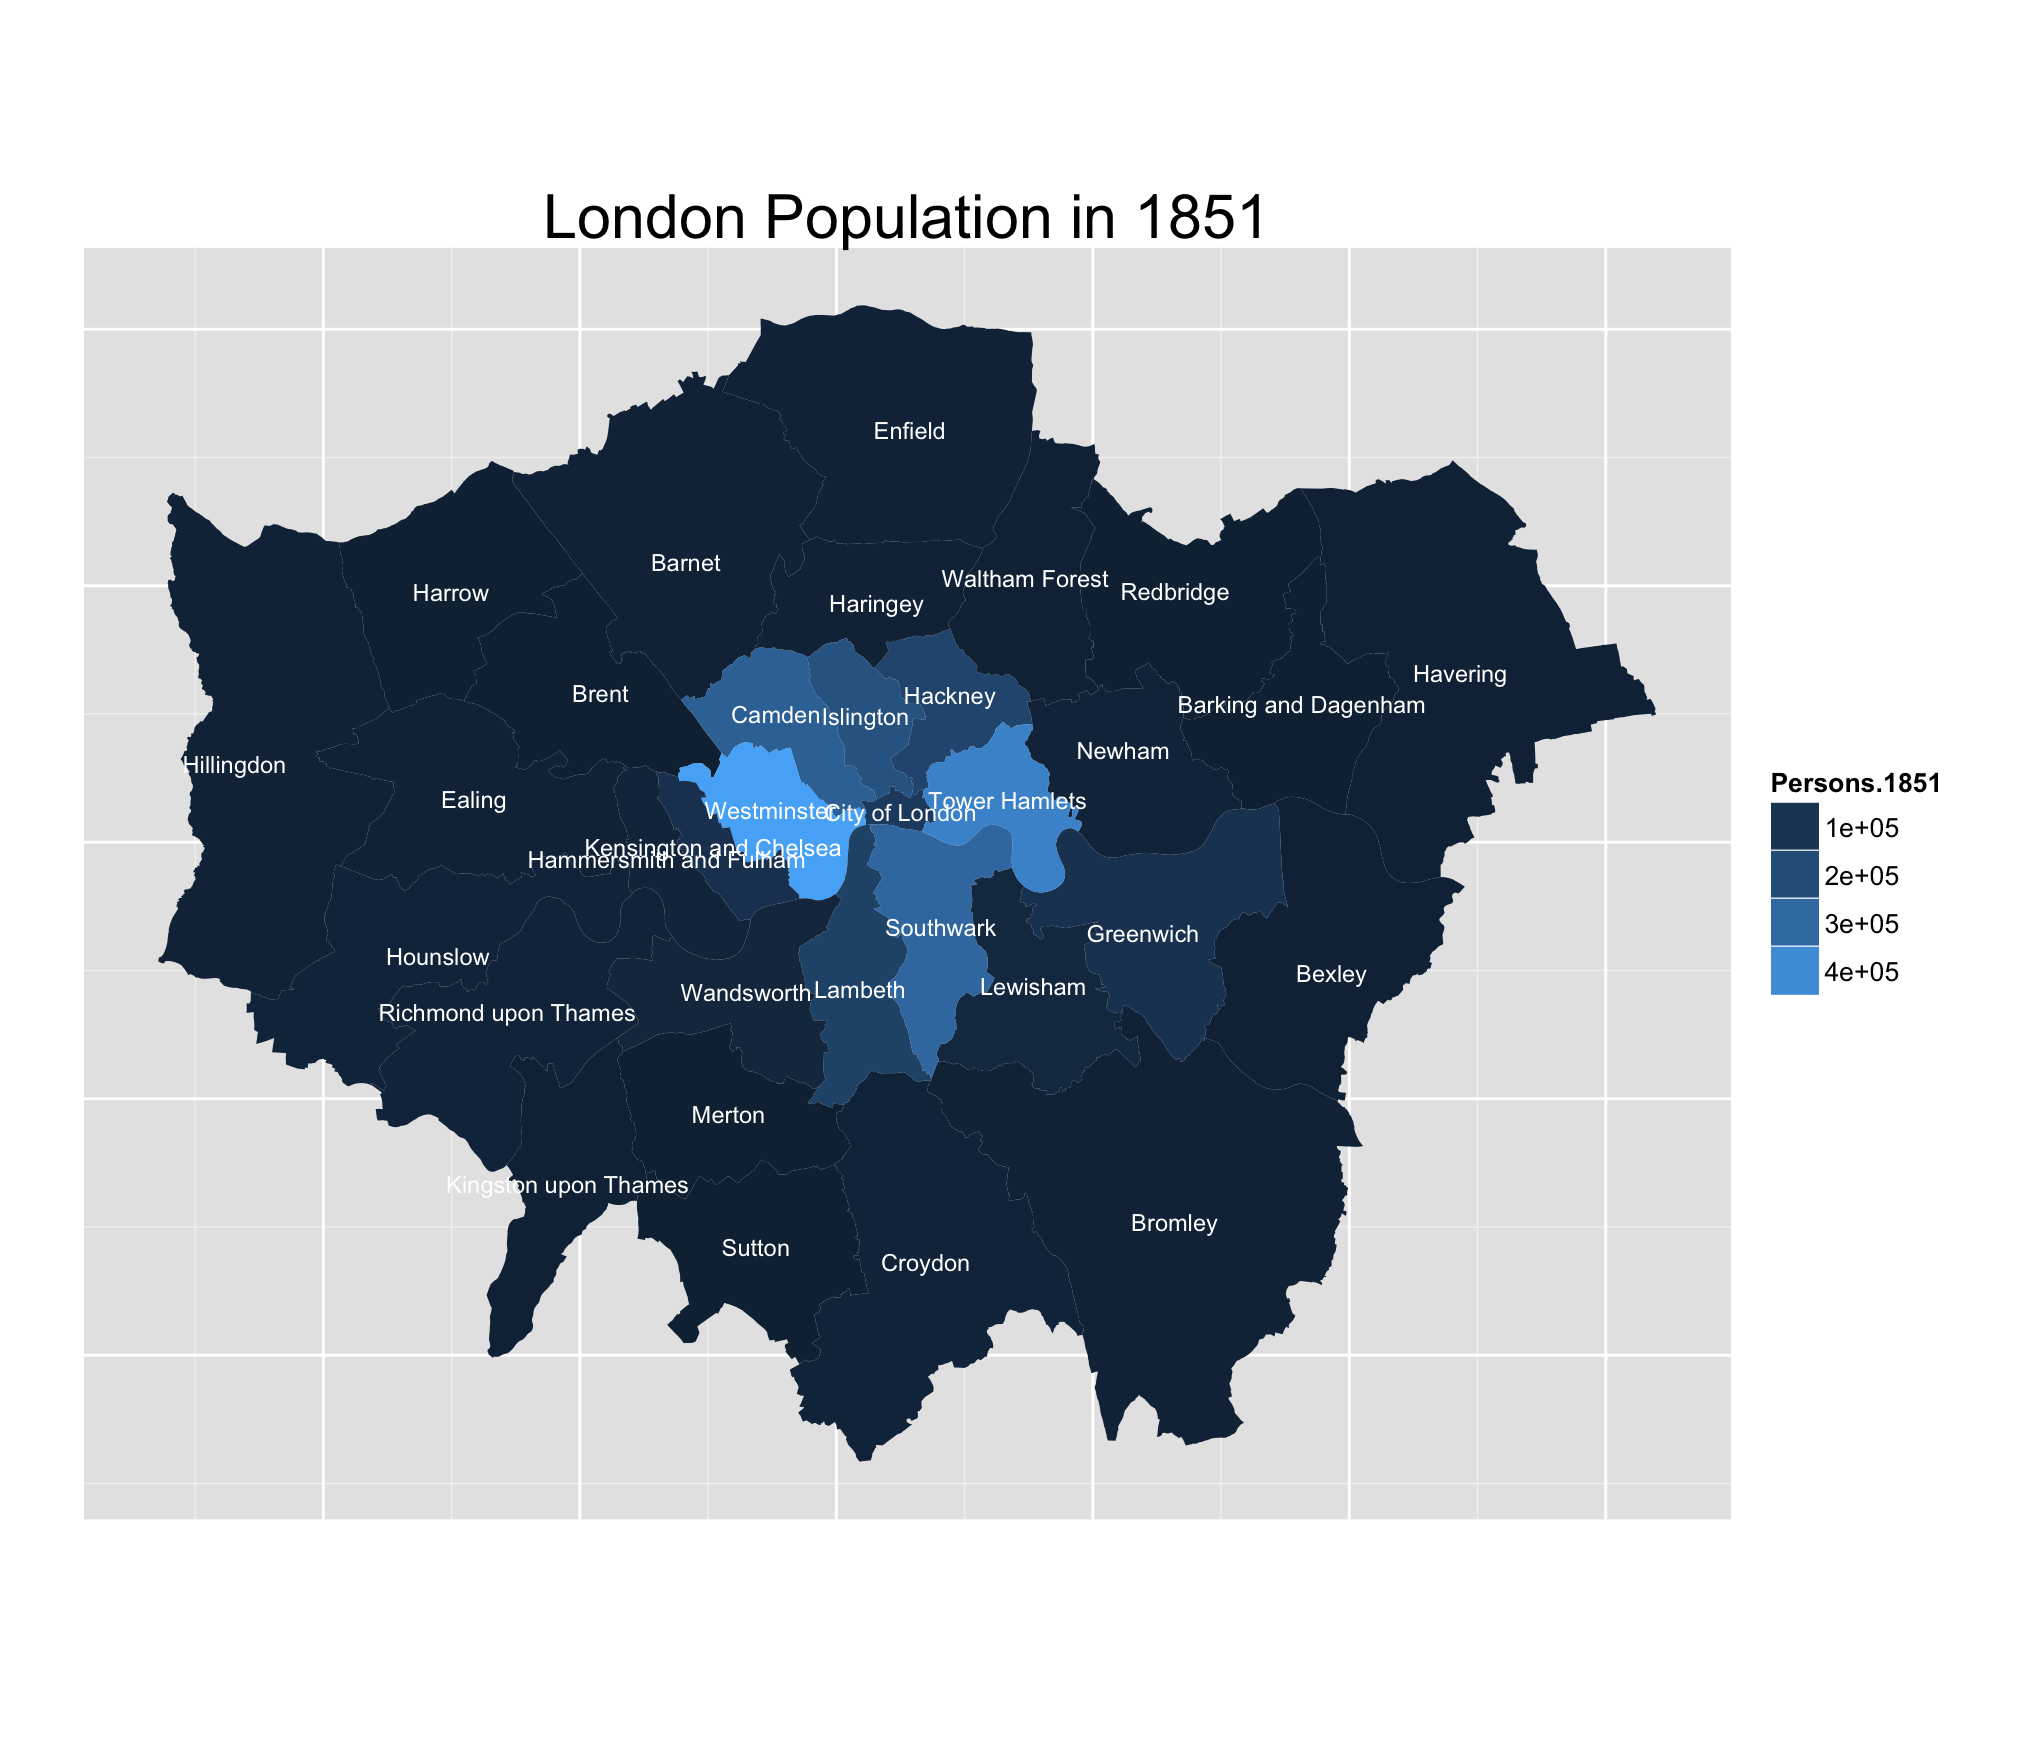
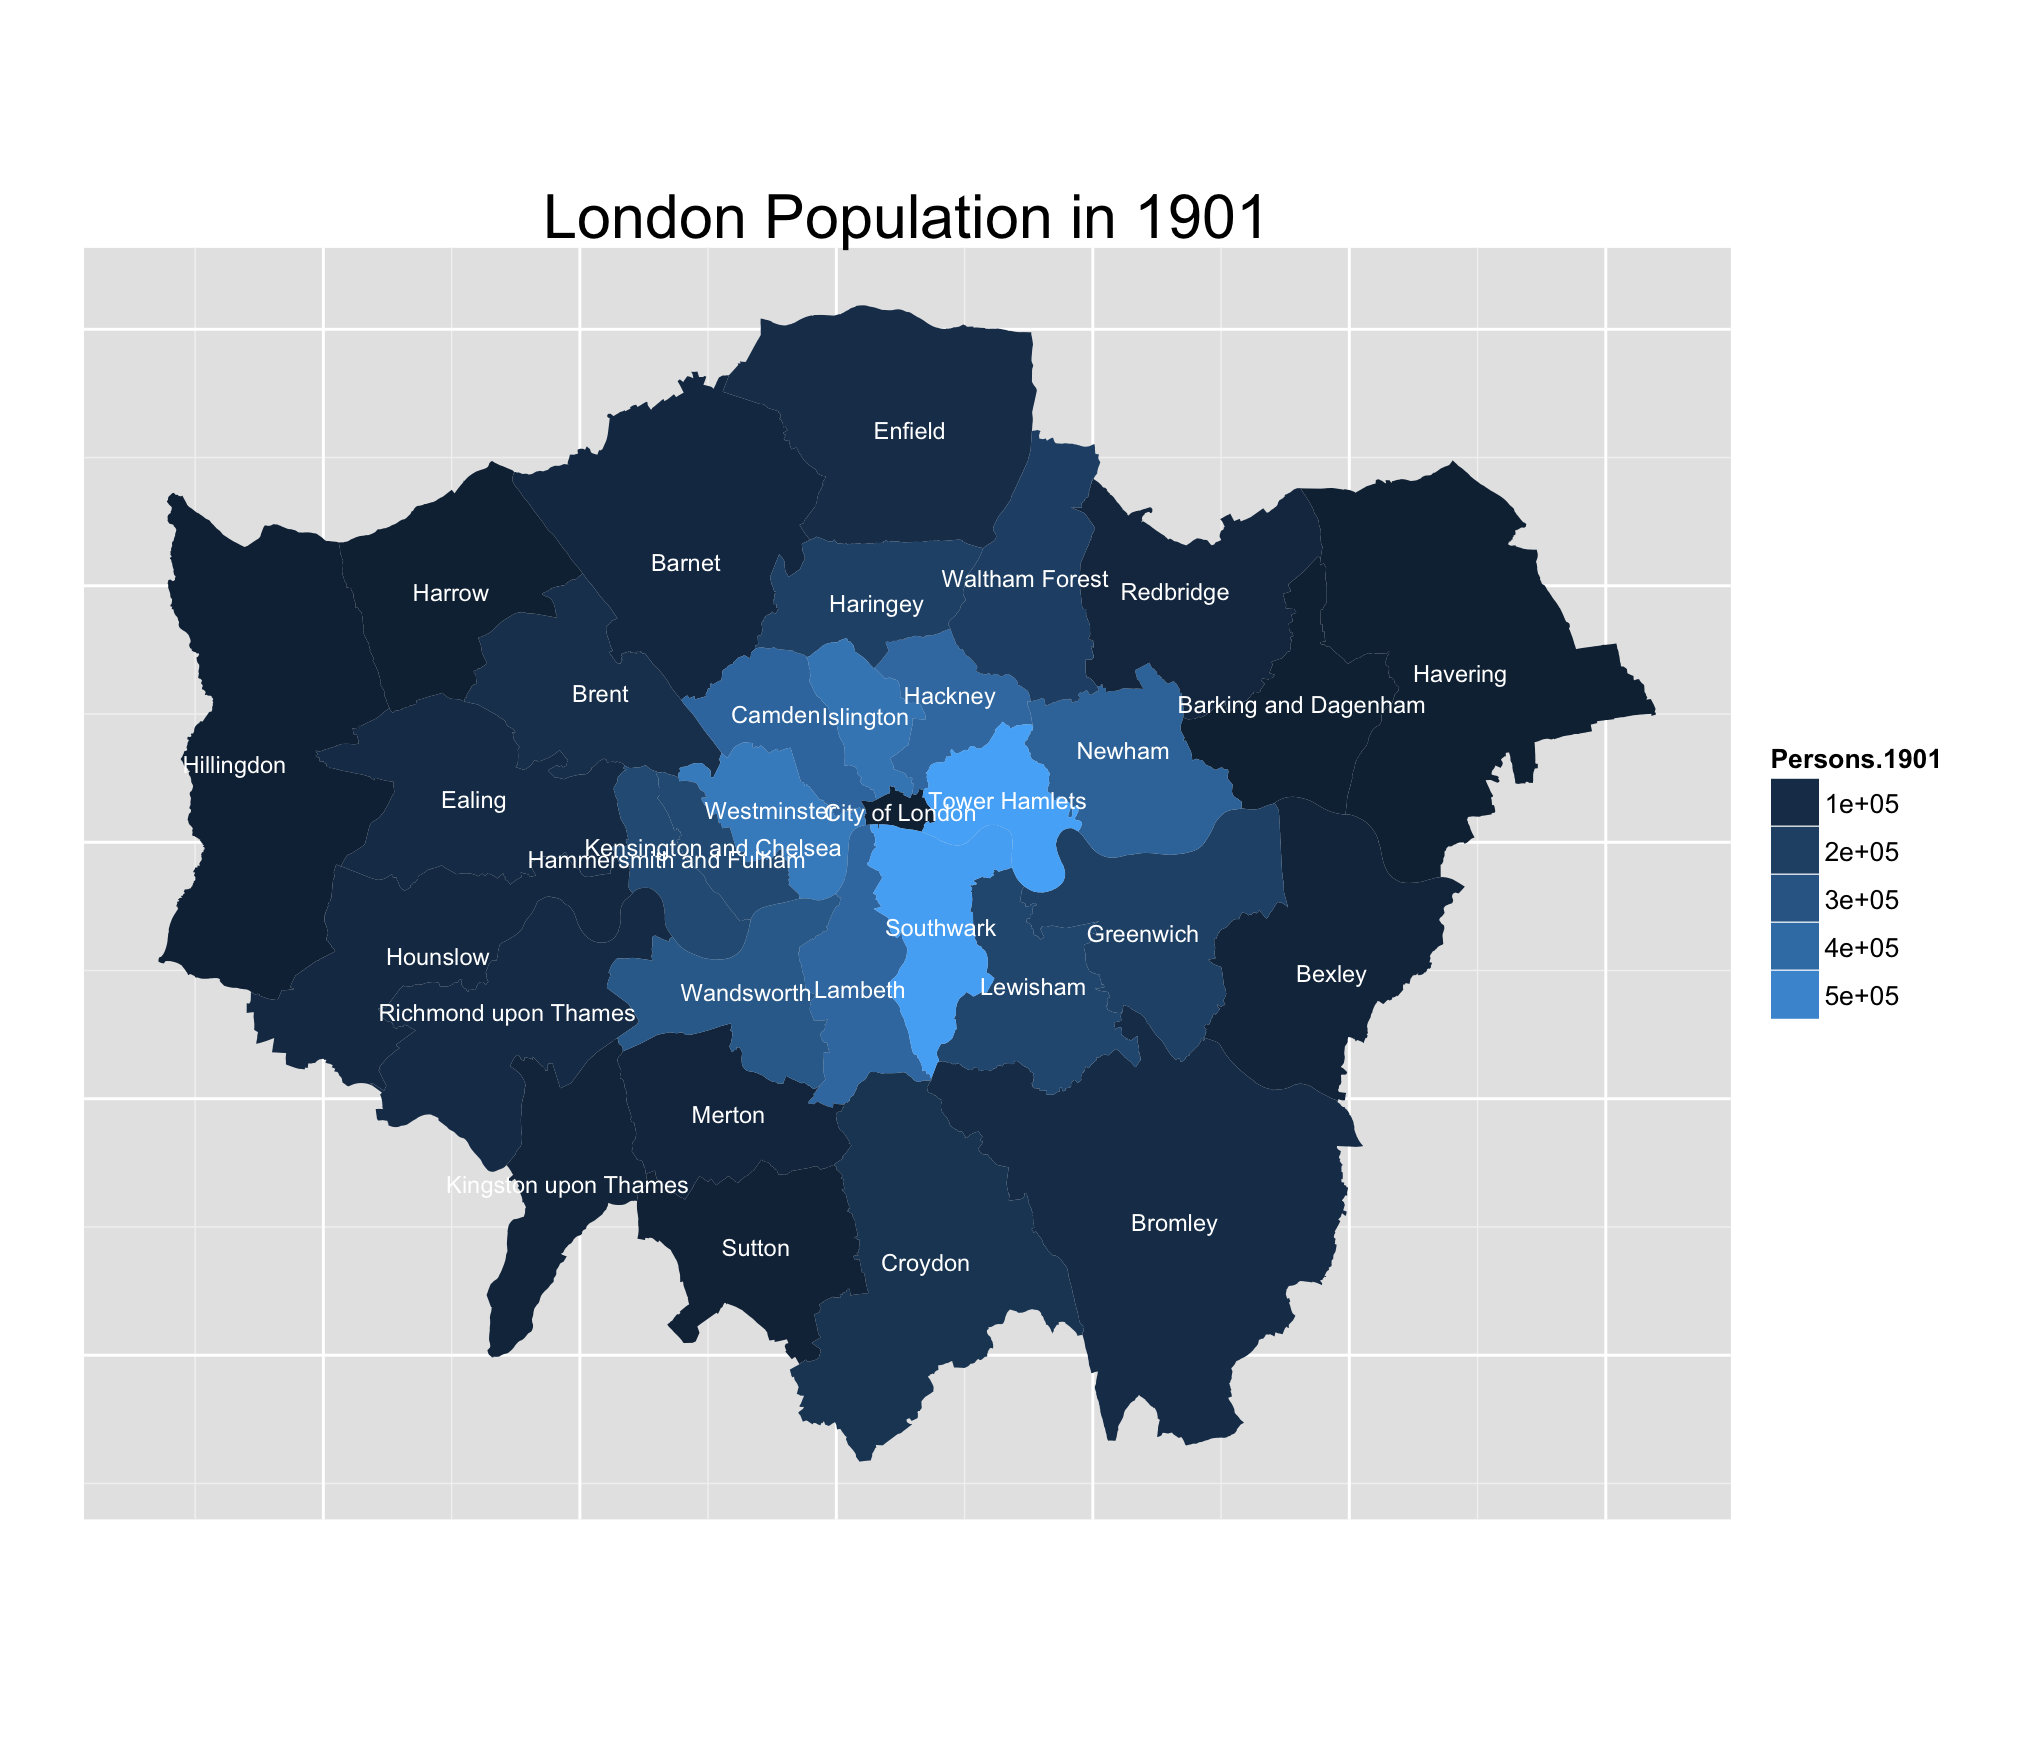
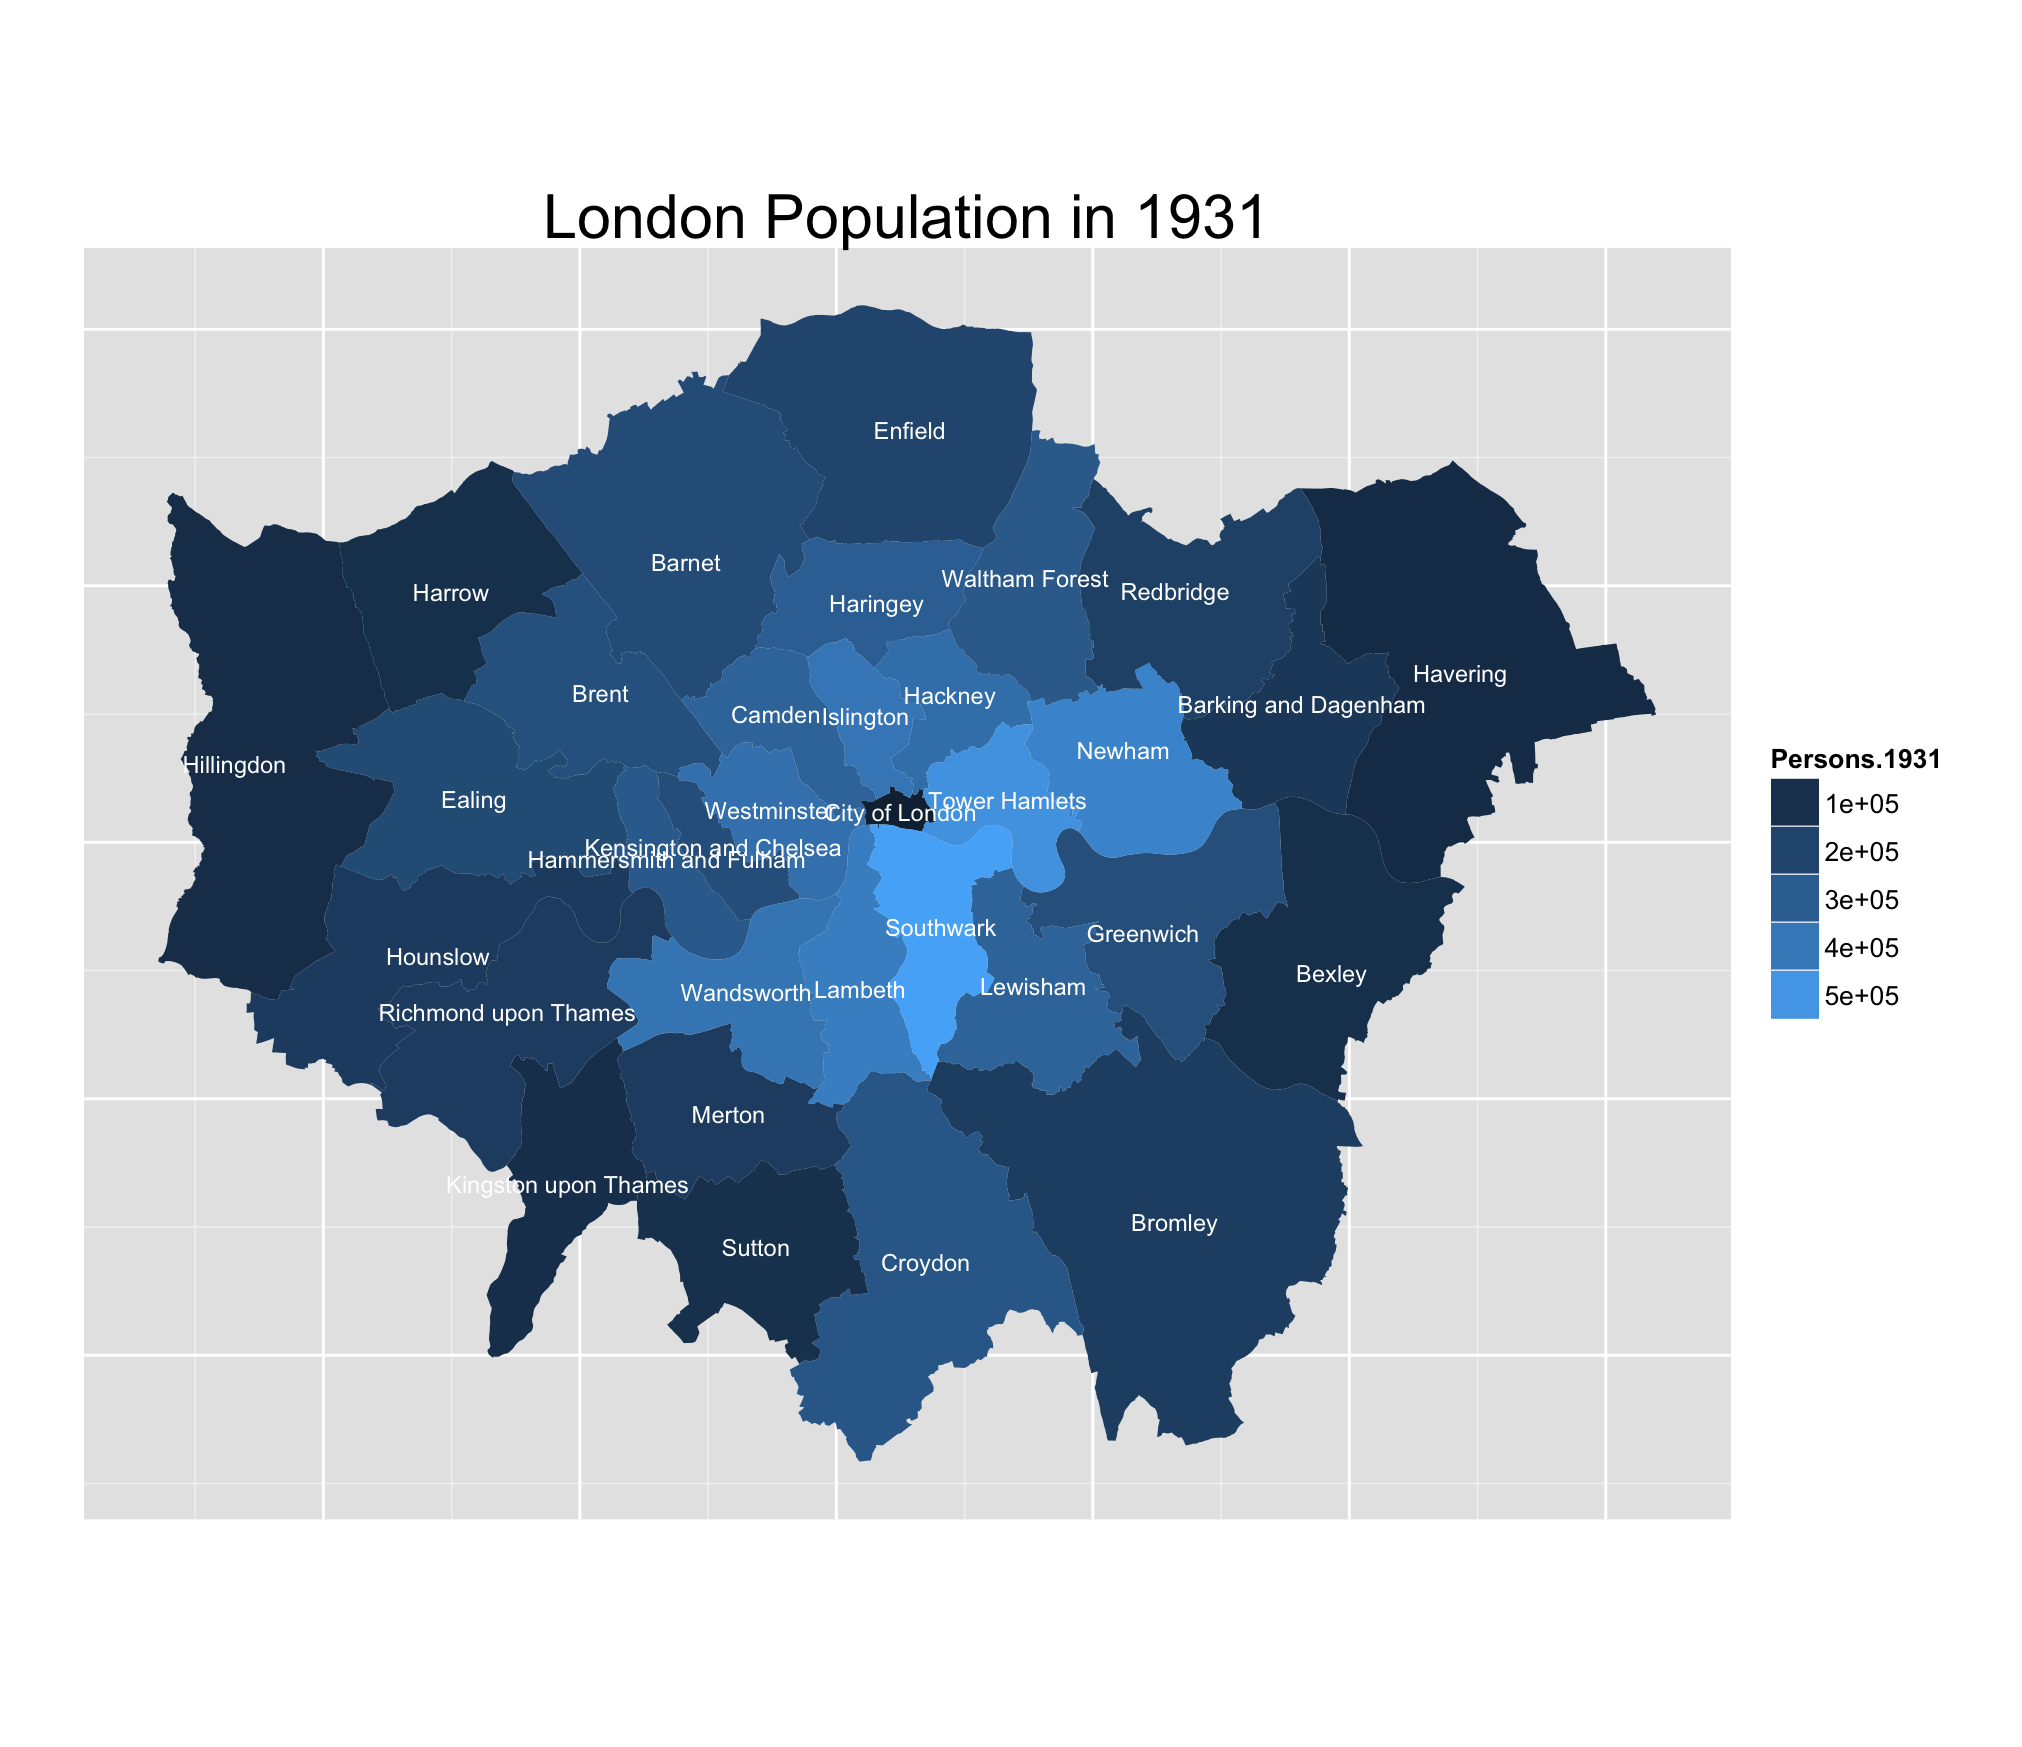
After the second world war, there's the most noticeable increase in population of the external boroughs; Barnet, Croydon, Ealing are rapidly moving from average-low inhabited boroughs to some of the most populated; all the other external boroughs show similar increases.
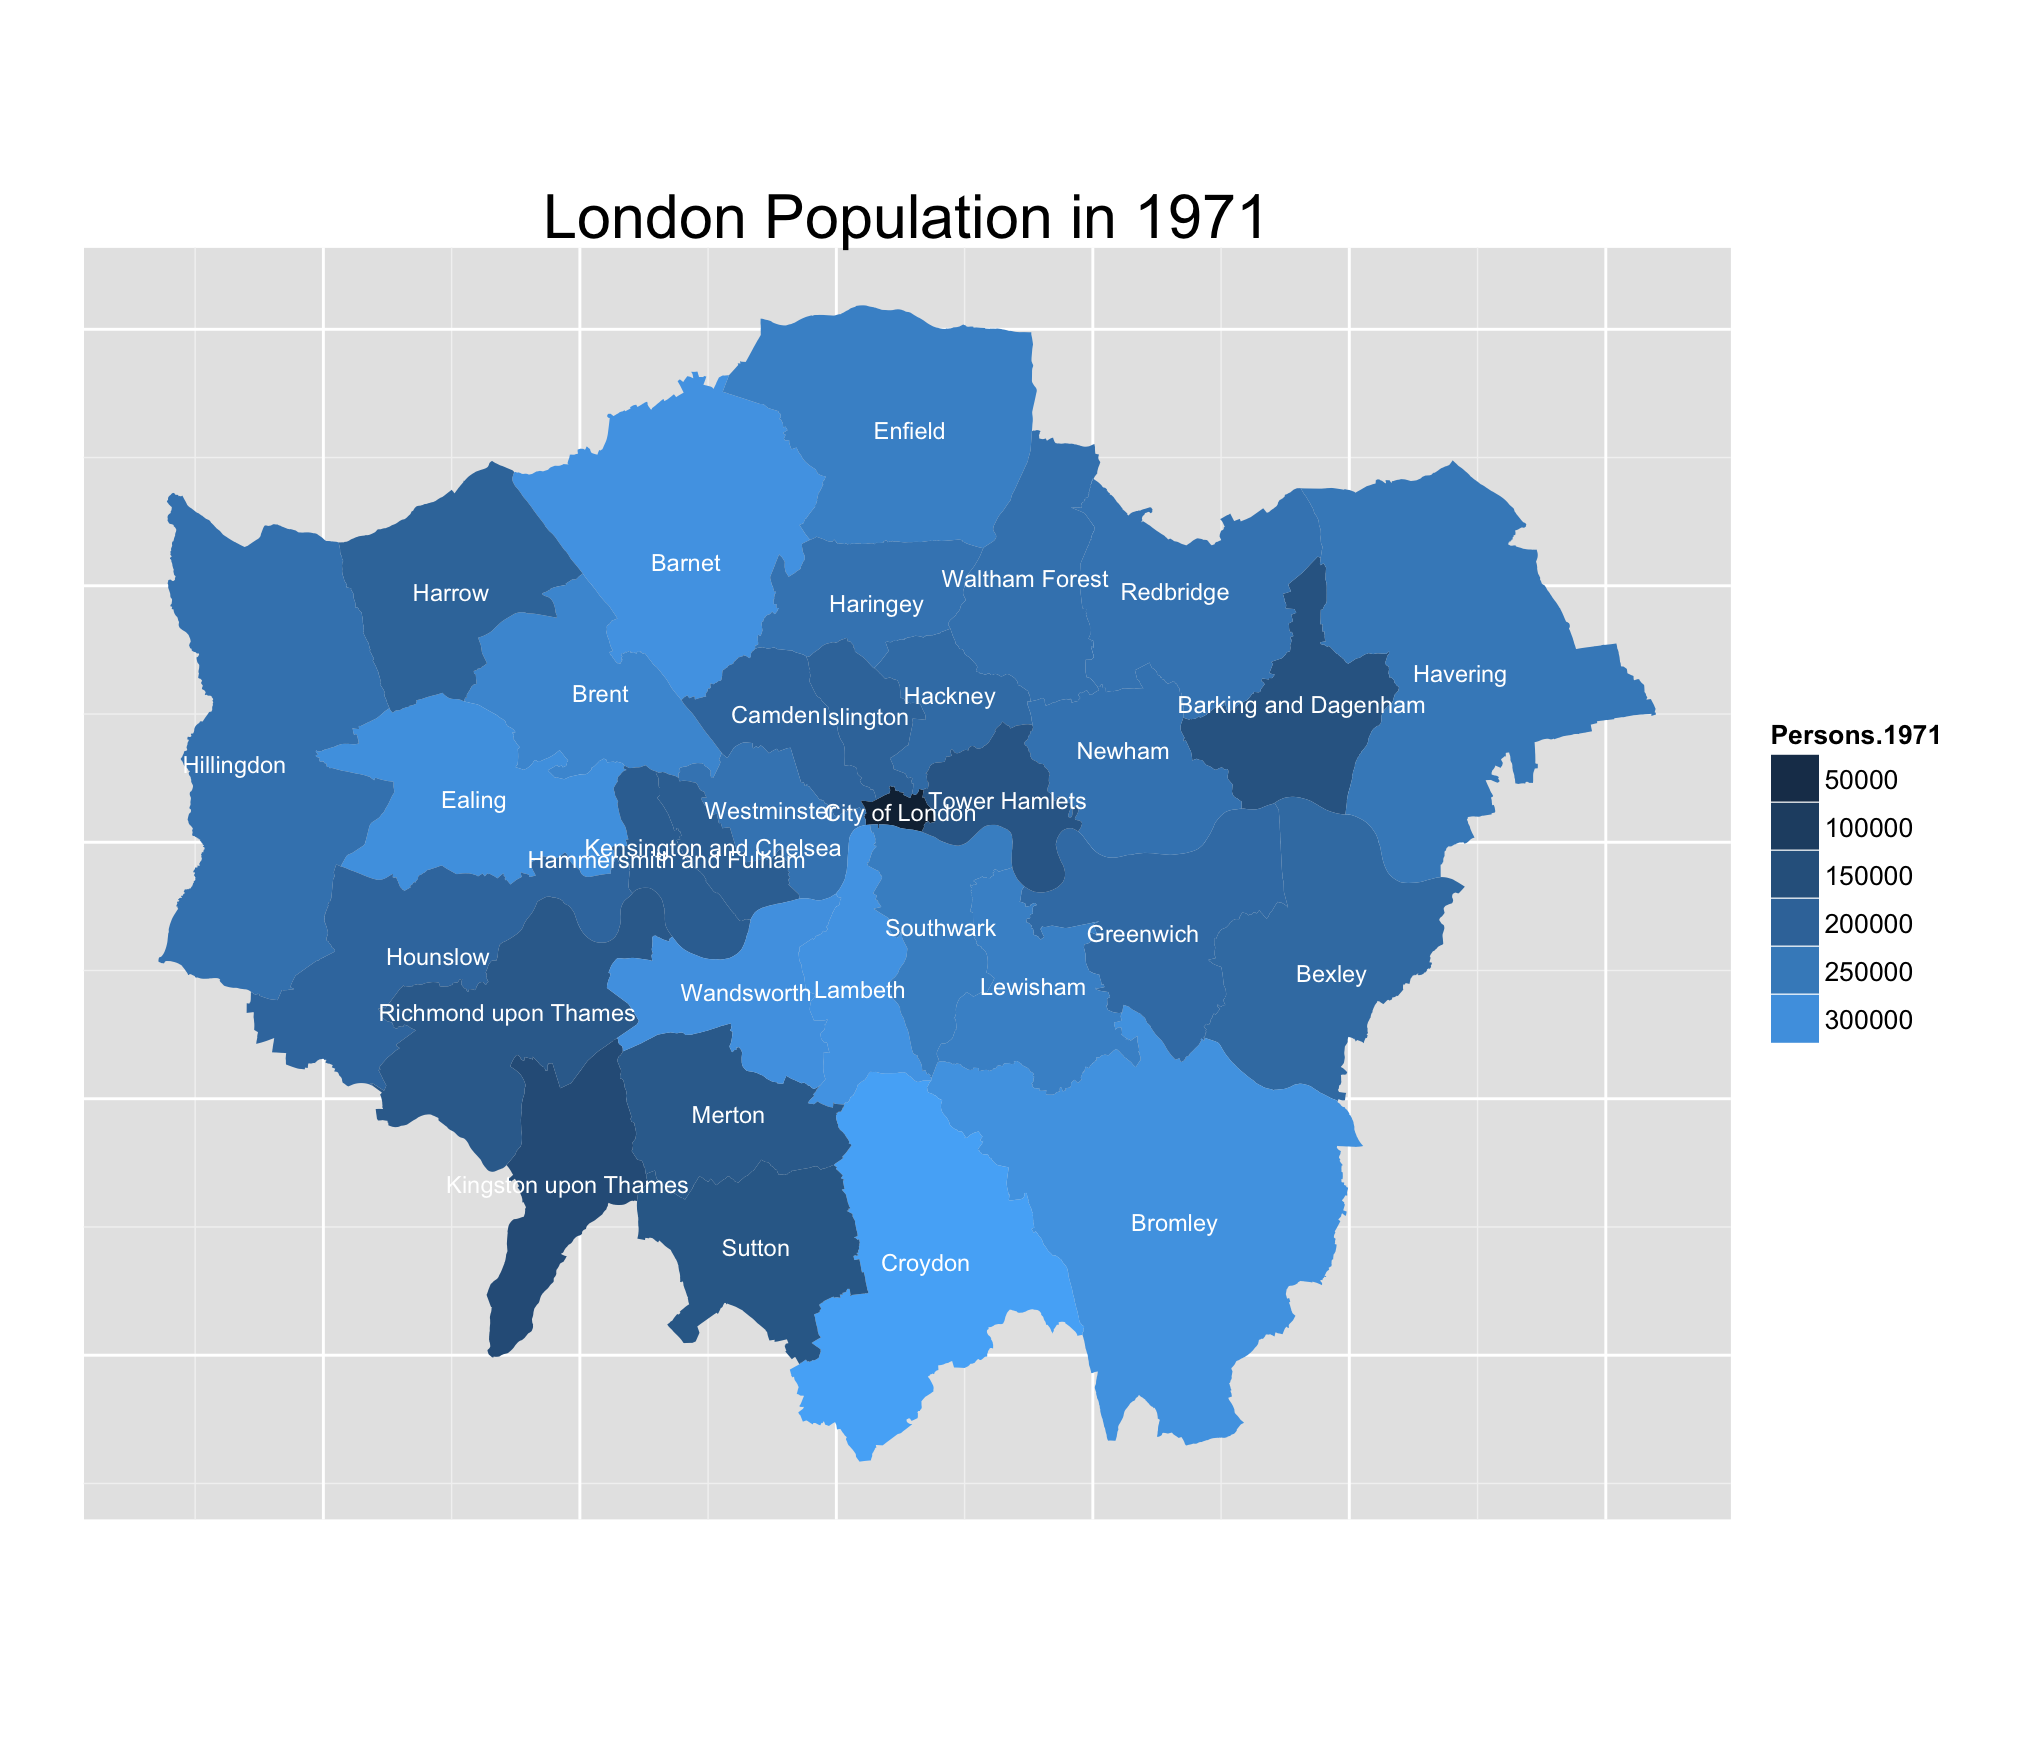
The last 30 years of the 20th century don't show a significant change in how the population is distributed.
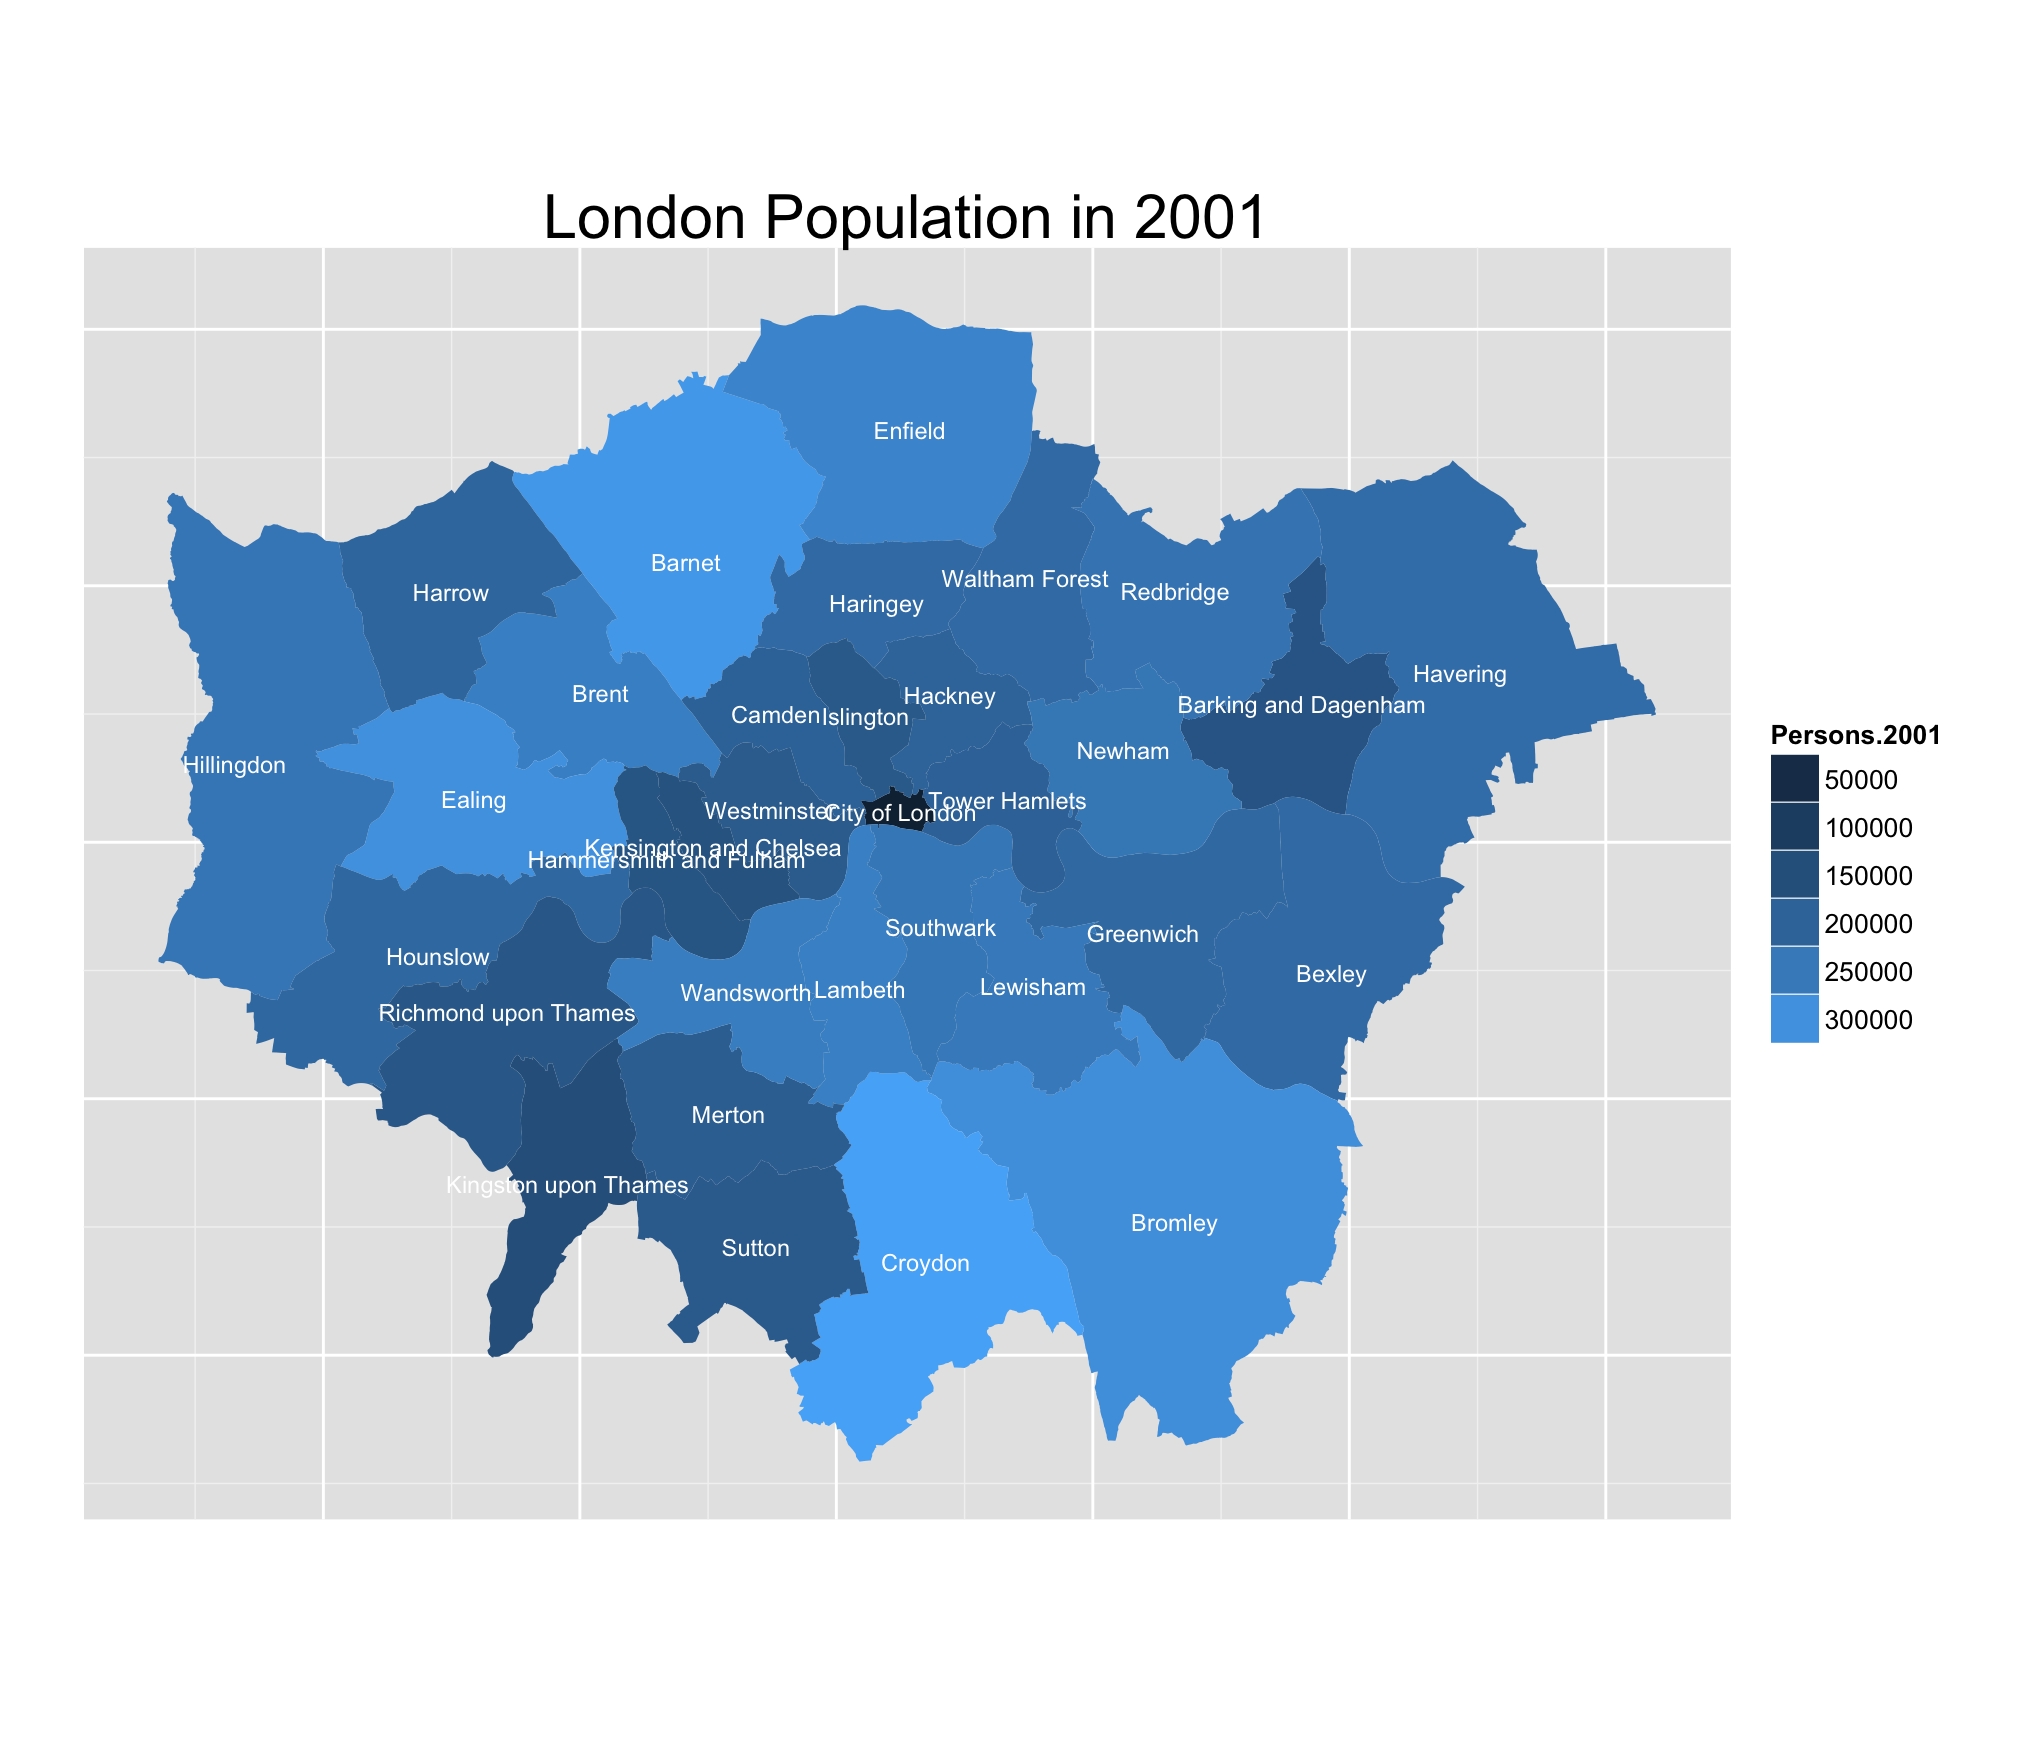
From a visualization point of view, working with R allows to create maps easily, and with a few lines of code. There are definitely a few things I'd like to improve, like the legend (which sometimes shows numbers in scientific notation, sometimes not, without an apparent reason), and the placement of borough names which sometimes make them difficult to read.
Unfortunately the general lack of documentation on R and its packages makes this fine-tuning procedure very hard and time consuming, but it has been surprisingly easy and quick to obtain some decent maps.